About
RGraph is a JavaScript charts library based on
HTML5 SVG and canvas. RGraph is mature (over 18 years
old) and has a wealth of features making it an ideal
choice to use for showing charts on your website.
Version 7.20
Version 7.20 (released in June 2026) is the
latest version of RGraph and the major change in
this version is an update to the default values
of properties making for better looking charts without
having to set any properties.
Read more about this and other changes in
the changelog.
Download
Get the latest version of RGraph (version 7.20, 9th June 2026) from
the download page. You can read the changelog here. There's also older versions available,
minified files and links to cdnjs.com hosted libraries.
Latest forum posts
These are the latest support forum posts that have been
posted or updated.
9th June, Richard
New version of RGraph: version 7.20
3rd June, Patrick
Question about installing RGraph
1st June, Ouja
How do I add a click event to a bar in my Bar chart?
8th May, Anthony Kuma
Does the SVG Line chart have outofbounds functionality?
License
RGraph can be used for free under the GPL or if
that doesn't suit your situation there's an
inexpensive (£129) commercial license available.What's going on with RGraph at the moment?
Written by Richard Heyes, RGraph author, on 18th June 2025
Here's an update for about what's currently happening with RGraph at the moment. A new release is nearing finalisation and it has some interesting updates in it to the datagrid such as searching (both basic and regular expression) and paging (client and server based), minor updates to the ModalDialog that allow you to rotate the dialog when showing or hiding it, a couple of new datetime functions that mimic PHP functions and make handling dates and times far easier, layout updates to the various API documentation pages, the ability to add your event listener functions inline within the configuration instead of using the on() function and then there's my favourite. This I might hold back for version 6.23 - but text appearance on canvas has never been very good in my opinion. Certainly not as good as SVG. But now I've happened across a technique that makes the text appearance much better. Here's an example of a regular Bar chart that hasn't been tweaked followed by a version of the same chart but having been tweaked to improve the text appearance:
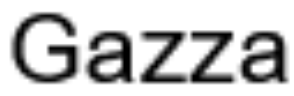
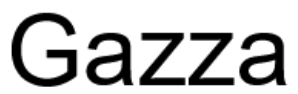
And here's a close-up of the "Gazza" label in the original (current) way that RGraph renders text and the new style:
Certainly an improvement I think that you'll agree! It still needs more work - especially in terms of working out coordinates for dynamic features. But the much improved appearance makes this a feature worth holding your breath for (but not too long - you do need to keep breathing!).