About
RGraph is a JavaScript charts library based on
HTML5 SVG and canvas. RGraph is mature (over 18 years
old) and has a wealth of features making it an ideal
choice to use for showing charts on your website.
Version 7.11
Version 7.11 (released in March 2026) is the
latest version of RGraph and contains just a few
updates to the code which you can see on
the changelog page. There's
a new dumbbell variation for the Bar and Horizontal bar
charts (both SVG and canvas) and the
front page layout of the
website has been tweaked.
HTML datagrid
In the April 2025 (v6.21) release a new datagrid object
was added.
This makes it easy to add static or dynamic data
tables to your pages. It can be used whether you use the
canvas or SVG libraries or entirely standalone.
Download
Get the latest version of RGraph (version 7.11, 21st March 2026) from
the download page. You can read the changelog here. There's also older versions available,
minified files and links to cdnjs.com hosted libraries.
License
RGraph can be used for free under the GPL or if
that doesn't suit your situation there's an
inexpensive (£129) commercial license available.Dumbbell variation for the Horizontal Bar chart
Written by Richard Heyes, RGraph author, on 2nd March 2026
Update: There's now support for not just the canvas Horizontal Bar chart but also the canvas (vertical) Bar chart, the SVG Horizontal Bar chart and the SVG (vertical) Bar chart too. You can see examples of these in the demos folder of the download archive.
A new dumbbell chart variation has been added to the SVG and canvas Horizontal Bar charts as you can see from the image that's shown here. This particular example is a grouped example, which can be achieved by using multiple chart objects (though the code is quite simple - as you can see below the image).
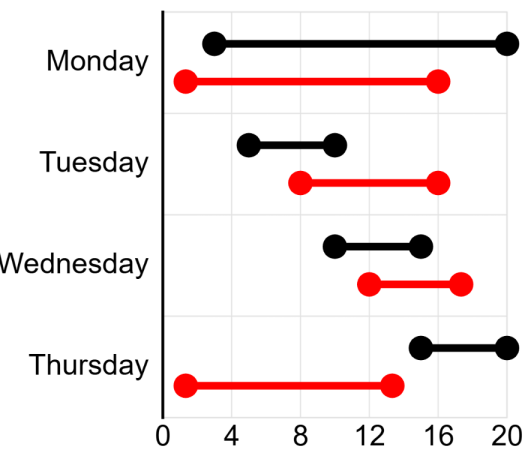
The data for the dumbbell chart is slightly different to a Bar chart in that there are two or more scale values given and these values are the points that you will see marked on the chart. It's unlike a stacked Bar chart where the values are accumulative. For example, with a stacked Bar chart, if you give [3,6,8] you will see bars that go from 0-3, 3-9 and 9-17). Whereas with a dumbbell chart you will see a dumbell that starts at 3, has a section that goes up to 6 and then finishes at 8.
Here's the code that makes the dumbbell chart example above:
<script>
    new RGraph.HBar({
        id: 'cvs',
        data: [0,0,0,0],
        options: {
            yaxisLabels: ['Monday','Tuesday','Wednesday','Thursday'],
            yaxisLinewidth: 3,
            yaxisTickmarks: false,
            xaxis: false,
            marginLeftAuto: false,
            marginLeft: 200,
            textSize: 23,
            yaxisLabelsOffsetx: -10,
            xaxisScaleMax: 20
        }
    }).draw();


    new RGraph.HBar({
        id: 'cvs',
        data: [[3,20],[5,10],[10,15],[15,20]],
        options: {
            variant: 'dumbbell',
            // variantDumbbellLinewidth: 4,
            // variantDumbbellEndLeft: false,
            // variantDumbbellEndRight: false,
            // variantDumbbellEndLeftRadius: null,
            // variantDumbbellEndRightRadius: null,
            // variantDumbbellEndRadius: 15,
            shadow: false,
            colors: ['#000'],
            textSize: 23,
            yaxisLinewidth: 3,
            yaxisTickmarks: false,
            yaxisLabelsOffsetx: -5,
            xaxis: false,
            xaxisScale: false,
            yaxis: false,
            backgroundGrid: false,
            xaxisLabelsCount: 4,
            marginLeftAuto: false,
            marginLeft: 200,
            marginTop: 15,
            marginBottom: 55,
            tooltips: ['Jim (b)','Berty (b)','Lois (b)','Cava (b)'],
            tooltipsOffsety: 10
        }
    }).grow();

    new RGraph.HBar({
        id: 'cvs',
        data: [[1,12],[6,12],[9,13],[1,10]],
        options: {
            variant: 'dumbbell',
            shadow: false,
            colors: ['red'],
            yaxis: false,
            xaxis: false,
            xaxisScale: false,
            backgroundGrid: false,
            marginLeftAuto: false,
            marginLeft: 200,
            marginTop: 55,
            marginBottom: 15,
            marginInner: 35,
            tooltips: ['Jim (r)','Berty (r)','Lois (r)','Cava (r)'],
            tooltipsOffsety: 10
        }
    }).grow();
</script>