About
RGraph is a JavaScript charts library based on
HTML5 SVG and canvas. RGraph is mature (over 18 years
old) and has a wealth of features making it an ideal
choice to use for showing charts on your website.
Version 7.11
Version 7.11 (released in March 2026) is the
latest version of RGraph and contains just a few
updates to the code which you can see on
the changelog page. There's
a new dumbbell variation for the Bar and Horizontal bar
charts (both SVG and canvas) and the
front page layout of the
website has been tweaked.
HTML datagrid
In the April 2025 (v6.21) release a new datagrid object
was added.
This makes it easy to add static or dynamic data
tables to your pages. It can be used whether you use the
canvas or SVG libraries or entirely standalone.
Download
Get the latest version of RGraph (version 7.11, 21st March 2026) from
the download page. You can read the changelog here. There's also older versions available,
minified files and links to cdnjs.com hosted libraries.
License
RGraph can be used for free under the GPL or if
that doesn't suit your situation there's an
inexpensive (£129) commercial license available.The bezierCurveTo function
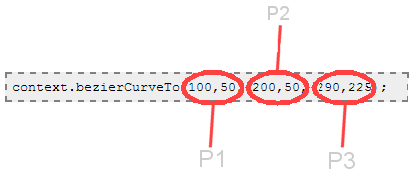
Like the quadraticCurveTo function, the bezierCurveTo function can be used to add curves to your chart. It uses the existing pen position as the start point and then the first two coordinates as the first control point, the second two coordinates as the second control point and the last two coordinates that you give it as the endpoint. The curve that is drawn will not necessarily pass through the control points.
Arguments to the function
- The X1 coordinate (of the first control point, P1 on the diagram)
- The Y1 coordinate (of the first control point, P1 on the diagram)
- The X2 coordinate (of the second control point, P2 on the diagram)
- The Y2 coordinate (of the second control point, P2 on the diagram)
- The X3 coordinate (of the end-point, P3 on the diagram)
- The Y3 coordinate (of the end-point, P3 on the diagram)
P0 is not specified on the bezierCurveTo function - this is done by a moveTo call before the bezierCurveTo call. As shown below.
An example
<script>
    window.onload = function ()
    {
        var canvas  = document.getElementById("cvs");
        var context = canvas.getContext('2d');

        context.beginPath();

        // This is where the curve begins (P0)
        context.moveTo(10, 225);

        context.bezierCurveTo(100,50,200,50,290,225);

        context.stroke();
    }
</script>