About
RGraph is a JavaScript charts library based on
HTML5 SVG and canvas. RGraph is mature (over 18 years
old) and has a wealth of features making it an ideal
choice to use for showing charts on your website.
Version 7.11
Version 7.11 (released in March 2026) is the
latest version of RGraph and contains just a few
updates to the code which you can see on
the changelog page. There's
a new dumbbell variation for the Bar and Horizontal bar
charts (both SVG and canvas) and the
front page layout of the
website has been tweaked.
HTML datagrid
In the April 2025 (v6.21) release a new datagrid object
was added.
This makes it easy to add static or dynamic data
tables to your pages. It can be used whether you use the
canvas or SVG libraries or entirely standalone.
Download
Get the latest version of RGraph (version 7.11, 21st March 2026) from
the download page. You can read the changelog here. There's also older versions available,
minified files and links to cdnjs.com hosted libraries.
License
RGraph can be used for free under the GPL or if
that doesn't suit your situation there's an
inexpensive (£129) commercial license available.The lineCap property
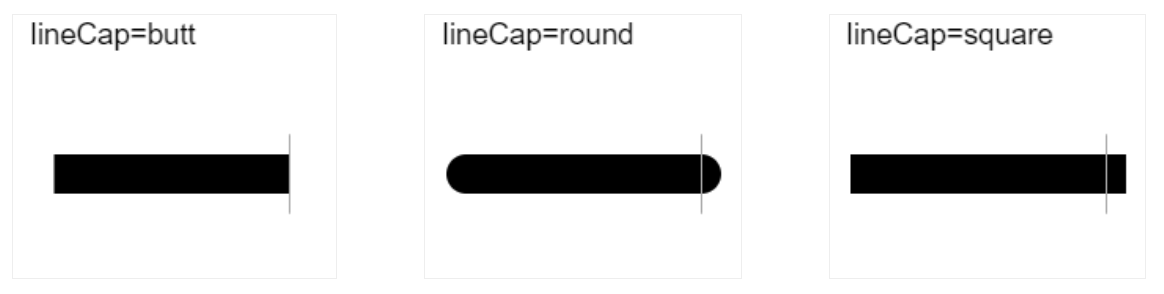
The lineCap property is used to change the way that the ends of lines are drawn. The possible values are butt (default), round and square. Examples of these are shown below. Although the butt and square settings appear to be the same you should note that the square setting has an overhang whilst the butt setting does not.
An example
<script>
    window.onload = function ()
    {
        var canvas  = document.getElementById("cvs");
        var context = canvas.getContext('2d');

        // Translate by half a pixel - this makes lines look crisp
        context.translate(0.5, 0.5);

        context.beginPath();
        context.lineCap = 'butt';
        context.lineWidth = 25;
        context.moveTo(25,100);
        context.lineTo(175,100);
        context.stroke();
    }
</script>